CT Pulmonary Angiography: Diagnosing Pulmonary Embolism
Pulmonary embolism (PE) is a potentially fatal yet treatable condition estimated to cause 100,000–180,000 deaths annually in the United States alone, remaining one of the most common preventable causes of in-hospital mortality. The widespread adoption of CT Pulmonary Angiography (CTPA) over the past three decades has transformed PE diagnosis from an often-delayed, invasive procedure into a rapid, non-invasive examination performable within minutes — fundamentally changing patient outcomes. This article provides a comprehensive educational guide to interpreting CTPA studies for pulmonary embolism.
CTPA Protocol and Technical Considerations
The technical quality of a CTPA study is paramount — a suboptimal scan is dangerous, as it can lead to both missed diagnoses and false-positive overcalling of filling defects in poorly opacified vessels. Modern CTPA protocol requires several key elements:
- Bolus tracking: Automated bolus-triggering software monitors the Hounsfield units (HU) in the pulmonary artery trunk; the scan begins when a threshold of 100–150 HU is reached in the main pulmonary artery
- Contrast volume and rate: 60–80 mL of iodinated contrast at 300–370 mg I/mL concentration, injected at 4–5 mL/s, followed by a saline chaser flush
- Window settings: Mediastinal window (W:400, L:40) for vascular evaluation; lung window (W:1500, L:-500) for parenchymal assessment
- Slice thickness: Axial reconstructions of 1–1.5 mm with multiplanar reformats (MPR) in coronal and sagittal planes to visualize subsegmental branches
Adequate opacification of the pulmonary arteries — greater than 200 HU in the main PA — is essential for diagnostic confidence. Motion artifact from cardiac pulsation affecting the central pulmonary arteries, and respiratory motion from patient non-compliance, can both simulate or obscure filling defects.
Direct CT Signs of Pulmonary Embolism
The definitive CT diagnosis of pulmonary embolism is made by identifying intraluminal filling defects within the pulmonary arteries — areas of low attenuation (dark regions) surrounded by or adjacent to contrast-enhanced blood.
Central vs. Eccentric Filling Defects
A central filling defect is surrounded on all sides by flowing contrast, creating the "polo mint sign" on axial images or the "railway track sign" on reformatted images — indicating a large, non-occlusive thrombus that likely represents a more recent, acute embolism. An eccentric filling defect is adherent to the vessel wall, often indicating partially organized, older or chronic thrombus. Complete occlusion of a vessel with absent contrast opacification — the vessel appearing expanded by low-density material — is the most severe acute finding.
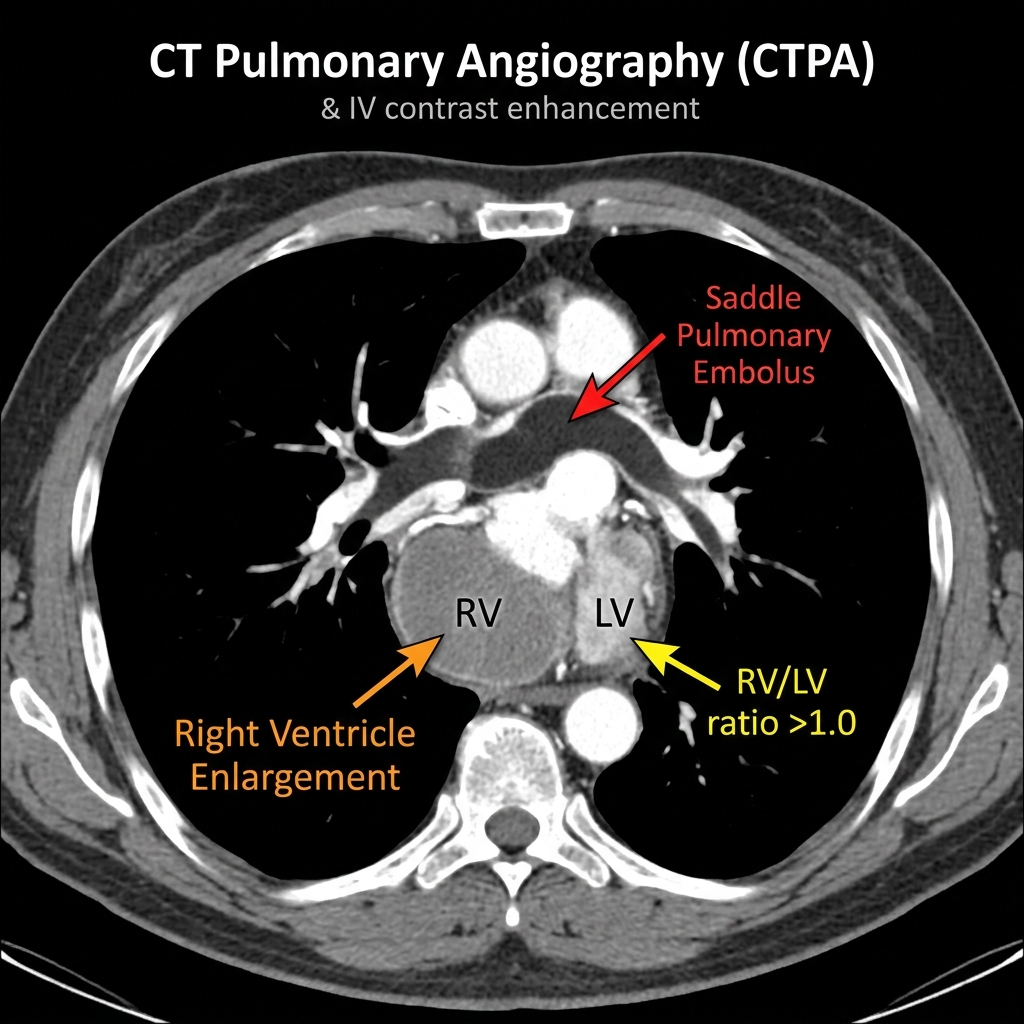
Saddle Embolus: A Life-Threatening Finding
A saddle embolus is a large, high-risk clot that straddles the bifurcation of the main pulmonary artery, extending into both the right and left main pulmonary arteries. This is a life-threatening finding indicating massive PE with potential for imminent hemodynamic collapse. When identified, the radiologist must immediately Alert the clinical team, as it represents a genuine emergency requiring consideration of urgent systemic thrombolysis, catheter-directed therapy, or surgical embolectomy.
Indirect CT Signs of Pulmonary Embolism
Beyond intraluminal filling defects, CTPA can reveal a constellation of secondary findings that support the diagnosis and reflect the physiological consequences of embolic obstruction.
Pulmonary Infarction: Hampton's Hump
When a pulmonary artery is completely occluded, the affected lung tissue may undergo hemorrhagic infarction. On CT, this appears as a peripheral, pleural-based, wedge-shaped area of consolidation with the apex pointing toward the hilum — the radiographic correlate of the classic Hampton's Hump. An associated pleural effusion (typically small and exudative) is common. CT may also demonstrate the feeding vessel sign — a directly visualized occluded pulmonary artery leading into the area of consolidation.
Regional Oligemia (Westermark Sign)
Regional loss of vascular markings distal to an embolic obstruction — the Westermark sign — represents decreased perfusion in the affected lobe or segment. On CT, this manifests as relative hyperlucency and decreased pulmonary vessel caliber in the oligemic territory compared to normally perfused lung, best appreciated on lung window settings with careful bilateral comparison.
Mosaic Attenuation in Chronic PE
In chronic thromboembolic pulmonary hypertension (CTEPH), the lung parenchyma may show a distinctive mosaic attenuation pattern — a patchwork of areas with differing density reflecting heterogeneous perfusion. Lung regions with preserved perfusion appear relatively dense, while oligemic zones appear darker. This pattern is exaggerated on expiratory CT images and should prompt further evaluation with V/Q scintigraphy and right heart catheterization.
Right Heart Strain: The Prognostic CT Signature
Assessment of right ventricular (RV) burden on CTPA is critical for risk stratification and treatment decisions. The following CT findings indicate significant RV strain and elevated mortality risk:
- RV/LV diameter ratio greater than 1.0: Measured on a four-chamber axial image; a ratio greater than 0.9–1.0 indicates significant RV enlargement and is strongly associated with increased 30-day mortality
- Intraventricular septal bowing: The interventricular septum bows leftward toward the LV due to RV pressure overload — producing the characteristic D-shaped LV appearance
- Main pulmonary artery dilatation: A PA diameter greater than 29 mm in the context of acute PE supports significant clot burden and elevated pulmonary pressures
- Contrast reflux into the IVC and hepatic veins: Dense contrast filling the inferior vena cava and hepatic veins indicates elevated right atrial pressure due to severe tricuspid regurgitation or frank RV failure
Quantifying Clot Burden: The Qanadli Score
The Qanadli CT Pulmonary Obstruction Index is a validated tool for quantifying PE clot burden. The pulmonary vasculature is divided into 20 segmental arteries (10 per lung), and each is scored based on the presence and completeness of obstruction. Scores greater than 40% correlate strongly with hemodynamic instability, right ventricular dysfunction, and elevated troponin levels — all markers of the intermediate-high risk and high-risk PE categories per ESC guidelines.
Distinguishing Acute from Chronic PE
This distinction is clinically important, as treatment approaches differ significantly. Chronic thrombus on CT characteristically appears as eccentric, web-like filling defects or intraluminal bands; vessel wall thickening and calcification; recanalization channels creating a "train track" appearance; and associated imaging features of pulmonary arterial hypertension including PA dilatation, right ventricular hypertrophy, and pericardial effusion.
Differential Diagnosis and Common Pitfalls
Motion artifact — particularly pulsation artifact in the central pulmonary arteries — is the most common source of false-positive PE diagnosis on CTPA. Additional pitfalls include streak artifact from dense contrast in adjacent vessels, mucus plugging of airways simulating subsegmental PE, and partial volume averaging in small vessels. Reporting radiologists should always confirm suspected filling defects in two imaging planes using multiplanar reformats. Subsegmental PE (SSPE) remains a diagnostic challenge with significant inter-observer variability even among experienced radiologists.
Structured Reporting: What Every CTPA Report Must Include
An optimal CTPA report for PE should systematically address: adequacy of contrast opacification and technical quality; presence, location (proximal vs. distal), laterality, and number of filling defects; estimated clot burden (Qanadli score or descriptive categorization as massive, submassive, or mild); right heart strain assessment (RV/LV ratio, septal deviation, IVC reflux); parenchymal findings (infarction, consolidation, pleural effusion, lymphadenopathy); and any significant incidental findings. Risk stratification language aligned with current ESC or AHA guidelines — high-risk, intermediate-high risk, intermediate-low risk, low-risk — should be included to directly inform clinical management decisions.